

There are now literally thousands of studies documenting the efficacy of using ultrasound for diagnosing complications related to COVID-19. Although CT combined with a PCR test is likely the best test for confirming COVID, ultrasound is a suitable alternative especially considering that ultrasound is typically easier and faster to access and does not expose the patient to radiation. 1
The studies indicate that not only does lung ultrasound predict COVID with really high sensitivity and specificity compared to CT, but it also predicts the clinical course. A review of patients getting hospitalized shows they almost all universally presented with lung ultrasound pathologic findings. Furthermore, you could actually score those findings to predict how sick the patients were, even predicting the need for invasive mechanical ventilation and a predictor of mortality.2
We recently heard first hand from an attending physician at Vancouver General Hospital about his experience using ultrasound on COVID patients. Dr. Shane Arishenkoff, a general internist and point-of-care ultrasound lead for the hospital’s clinical teaching unit, shared his experience in the instructional webinar „POCUS for COVID and Beyond: Diagnosing Lung, Cardiac and Thromboembolic Diseases.“ Read on for Dr. Shane’s lung scanning tips and a detailed review of a COVID patient presenting with lung complications.
How to Identify Lung Pathology with Ultrasound
„Lung scanning enables us to look for a wide range of pathology. I break it down into two areas: number one, the pleura, and number two, what’s deep to the pleura. We will go over a detailed assessment of the pleura and learn how features of the pleural line can be informative about disease processes that affect the lung.
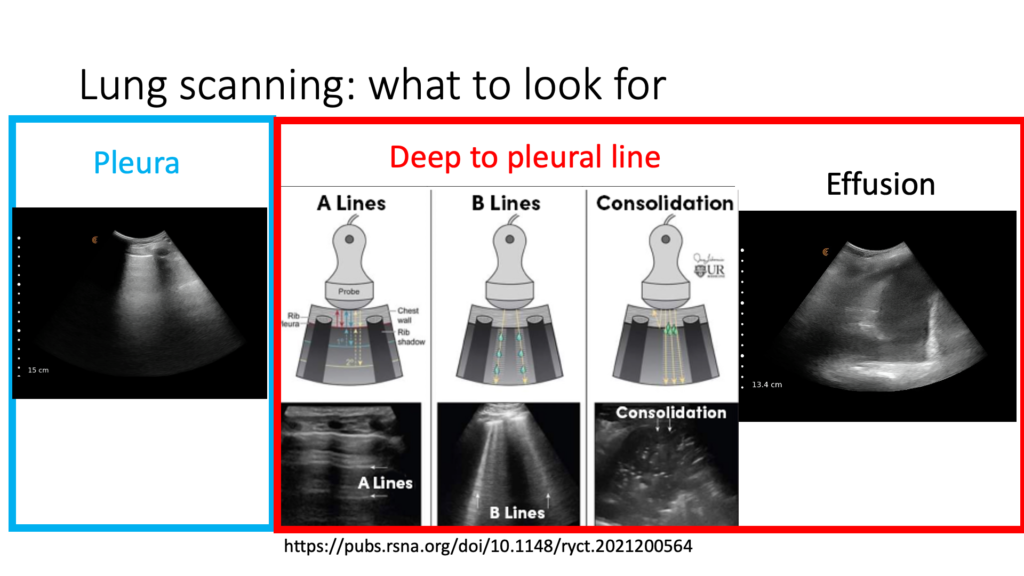
A Lines in a Normal, Healthy Lung
Notice how crisp and clean this pleura is in the image above. The normal pleura is a continuous linear structure at the border of the soft tissue and aerated lung. A-lines can be seen emanating below it at regular intervals. A-lines are horizontal reverberation artifacts that happen when you have soft tissue with mostly air interface, as is seen in normal lung.
B-lines
B-Lines are vertical artifacts that start at the pleural line and suggest that the interlobular septa are thickened which is the pathological correlate of interstitial syndromes.
Consolidation
Consolidation is the hepatized region of the lung where the lung takes on a soft tissue appearance suggesting that you have airspace disease.
Pleural Effusions
On this image, we see pleural effusions as the anechoic appearance of fluid within the chest cavity. This is often associated with atelectatic lung, and as we see here, the lung takes on a hepatized appearance.
6 Things to Look for When Scanning the Lungs
Scanning the pleural line with ultrasound provides a lot of information. When I set up for a lung scan, I look for several details to answer a series of clinical questions.
1. Lung Sliding
Is it reduced or is it absent? Disease processes associated with reduced or absent lung sliding goes beyond just pneumothoraxes. Static B-lines are seen when the pleural surfaces are adhering to one another and are associated with inflammatory or fibrotic interstitial processes.
2. Contour of the Pleura
Is it thin and crisp or does it appear thickened and irregular or interrupted?
3. Subpleural Consolidations
Are there small areas of hepatized regions of the lung just deep to the pleural line that don’t quite constitute a full lobar pneumonia?
4. Number of B-Lines
Are B-lines present? When I think about B-lines, I also think about the number because the number often correlates with how significant the disease process is.
5. Symmetry of B-Lines
Do you see B-lines in one lung zone on the right that are very similar to what you’re seeing on the left? Is there a dependent gradient associated with the B-lines? Cardiogenic pulmonary edema is often associated with a dependent gradient, meaning that there are more B-lines as we descend into the dependent regions of the lungs.
6. Skip Areas
Sometimes we see areas of normal lung that are directly adjacent to areas that are clearly diseased.
Optimizing the Angle of Insonation
The strongest echoes are produced when the angle of incidence approaches a 90-degree angle with the object of interest. It’s critical to optimize the angle of insonation of the pleura to produce A-lines and B-lines.
Illustrating the Angle of Insonation with a CT Scan
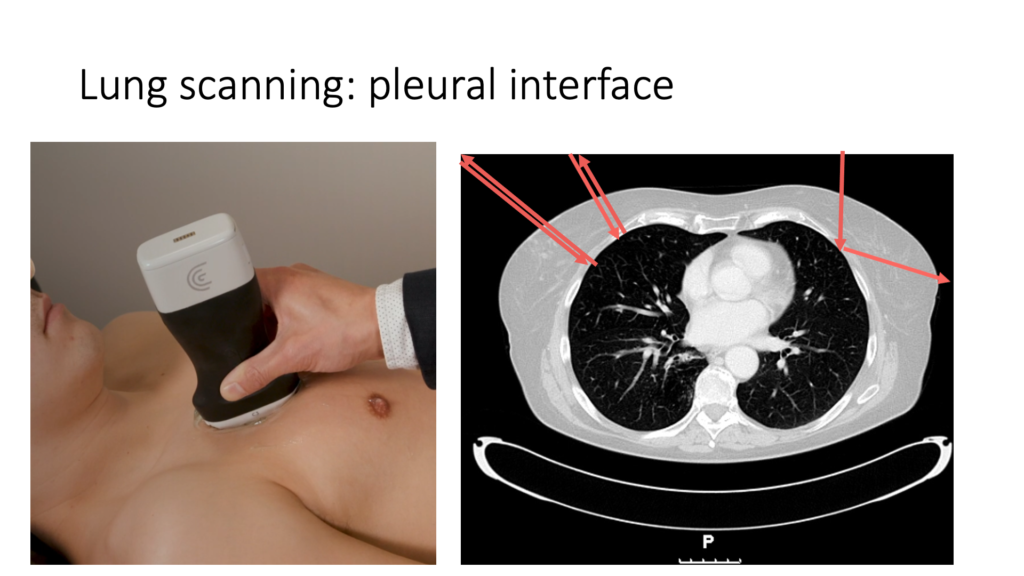
I’m using this CT scan to illustrate the concept of beam orientation or the angle of insonation. The red arrows indicate or represent the ultrasound beam as it comes towards the pleura and then reflects away from it.
The pleural line forms an interface between the soft tissue of the chest wall and the lung, which is mostly air. A soft tissue air interface creates a hyper-reflective surface, which the ultrasound beam does not penetrate.
For an optimal image, it’s important for the ultrasound beam to strike the pleura at a perpendicular angle as shown on the left. When it reflects at a perpendicular angle, most of the beam energy will return to the probe, producing a high-quality image of the pleura and revealing important artifacts such as the presence of A-lines or B-lines.
When the ultrasound beam strikes the pleura at an oblique angle, as seen on the right side of the screen, much of the beam energy will reflect away from the transducer, degrading the image of the pleura and obscuring artifacts, which will often render the image uninterpretable.
Case: 80-Year-Old Gentleman with Shortness of Breath, Fevers and a Cough
During a period of high COVID prevalence, I saw an 80-year-old gentleman. He had URTI symptoms a couple of weeks ago. He tested negative for COVID early on in the illness and has been at home. Subsequently, he started to feel a bit better, but now feels worse again over the past couple of days and is presented to the hospital. When he was first seen, his O2 Sat was 79% on room air, his heart rate was up at 105 and regular, and his temperature was 38.8. He had mild work of breathing at rest, but was not in distress. He has no real other contributory findings.
When we look at his investigations, there wasn’t much to be seen. His white cell count was normal, although he did have a slight decrease in his lymphocyte count. His repeat COVID test was pending and his ECG was not really contributory. A chest x-ray was done and it was helpful. In this particular chest x-ray, we do see abnormalities in both lung fields, namely ill-defined patchy opacities that certainly are in keeping with infection.
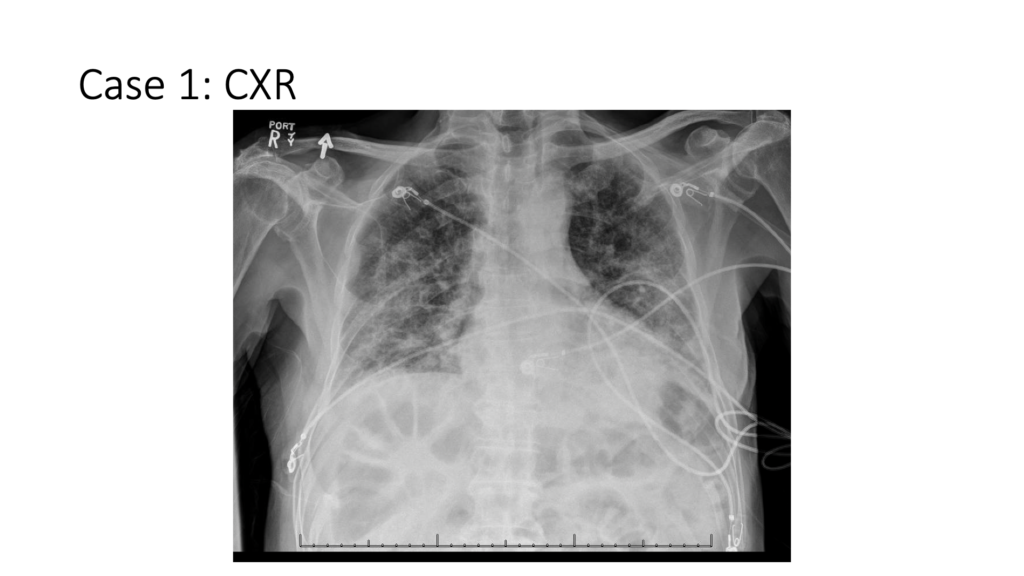
Based on this chest x-ray and the information we had gathered, and despite the fact that he had a negative COVID test, our differential diagnosis still included COVID as well as other respiratory infections or inflammatory illnesses that could do something like this to the lung. An ultrasound exam only heightened our suspicion that this was COVID and that the original negative test was, perhaps, just misleading.
CHEST Study: Review of Posterior and Dependent Regions
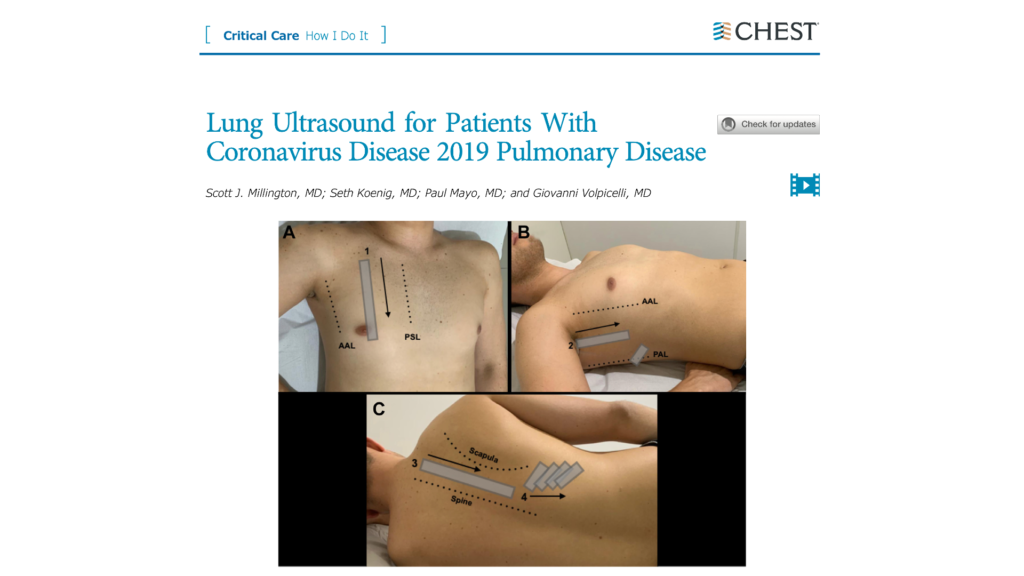
Let’s looks at this study in CHEST, which does a great job describing lung scanning protocol and describing the lung ultrasound features of COVID. In this particular study, they suggested that the anterior lung zone., the lateral lung zone in the midclavicular line and the posterior lung zone between the spine and the scapula should be scanned in multiple rib spaces. In addition, they paid particular focus to those dependent regions of the lungs. They looked to the literature to help inform where the lung ultrasound should be placed to find the features that are associated with COVID pneumonia.
The literature suggests that very frequently, there are findings in the posterior and dependent regions of the chest that we need to be aware of. Therefore, scanning only the anterior and lateral lung zones as is seen when examining for cardiogenic pulmonary edema, is probably not good enough.
Here’s what the study said about the types of findings that we see with the ultrasound that suggests COVID.
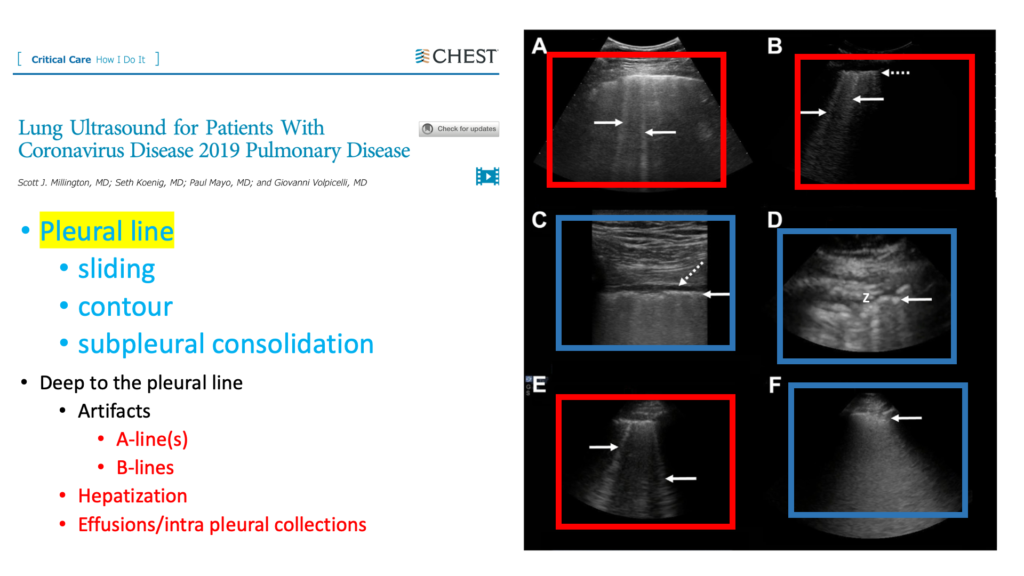
This is the figure from the paper itself where they show a ragged-looking pleural line labeled D. It shows a ragged, lumpy, bumpy and thick appearing pleural line. And if you look at F, there’s a small area of subpleural consolidation just deep to the pleural line. All of these features are commonly seen in COVID pneumonia in addition to the B-lines that suggest the interstitium of the lung is also affected.
Clarius Ultrasound Clips from Our Case
Anterior Lung of Patient with COVID-19
Here are the lung images from our 80-year-old gentlemen. Note: the illustration on the bottom left shows you where I placed my scanner to capture this clip with the Clarius C3 HD ultrasound scanner.
Starting here in the upper chest on the right side, what we can clearly see is a thick appearing, lumpy, bumpy, or irregular looking pleural line with multiple B-lines cascading down almost forming a complete lung whiteout. The other thing that I think is interesting is the stochastic nature of the movement of the pleura, which I often see when you have reduced sliding or a stickiness of the pleura.
Moving down to the next zone here, we see once again, that the pleura is affected, though with less B-lines than we had previously.
In this image, I decreased the depth to zoom in on the pleural line to interrogate it further. And you can clearly see just how thick appearing that pleural line is together with a lumpy and bumpy contour.
R Latera and Posterior Lung Ultrasound Clips from Patient with COVID-19
The next images show the right lateral and posterior lung. At the level of the axilla on the lateral chest there is a rather preserved looking pleural line, not as lumpy and bumpy, not thickened appearing and associated with a nice A-line pattern. There does seem to be a couple of B-lines hanging off the screen, but very different than what we saw on the anterior chest. I would suggest that this is a skip area, or a spared area, where we have a region of normal lung sitting right next to a region of lung that was clearly abnormal.
When moving down to the dependent regions, I like to come down to the diaphragm and the spine. If the spine doesn’t appear to continue on up into the chest, there is no pleural effusion present in this most dependent of regions.
And then sliding my transducer up a little cephalad from there, I come to a region of lung where, once again I don’t see much in the way of B-lines and the pleural line appears smoother. This relatively dependent region has fewer B-lines compared to the anterior zone. In other words, there is no dependent gradient to the number of B-lines.
Coming to the posterior zone, we can see that this lung is particularly affected here with what is almost a lung whiteout. Down to the costophrenic angle we see a little subpleural consolidation as we get towards the diaphragm. And then just sliding up above that, we see another region where the pleural line is clearly abnormal.
So not to belabor things, I will go through the left lung here now a little bit quicker because we see the same types of findings with this abnormal pleural line and multiple B-lines.
Below I zoomed in once again, and then over here down in the lower portion of the anterior zone of the left lung.
We’re demonstrating that this indeed is a bilateral process, and this assymetric B line pattern is associated with a very abnormal pleural line.
COVID Finding: The Posterior Scan has Much Higher Sensitivity
This very last image from the posterior scan demonstrates an area of consolidation, which is a little bit bigger than what we had seen previously with punctate bright areas within that region of hepatized lung. These are known as air bronchograms.
Case Summary
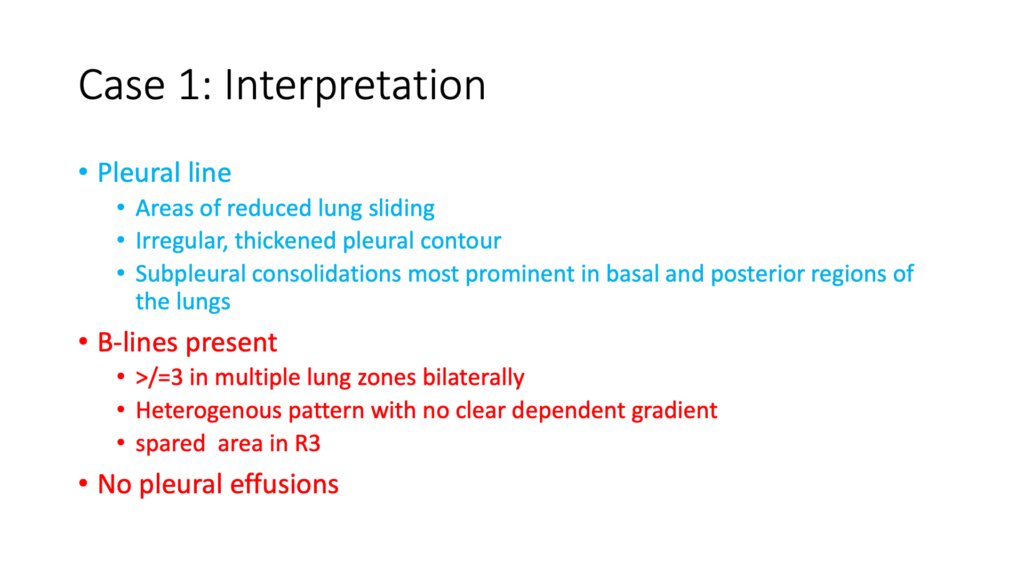
To summarize our findings, we have a pleural line with areas of reduced lung sliding, irregular thickened appearing pleural contour, and subpleural consolidations, most prominent in the basal and posterior regions of the lung.
Greater than or equal to three B lines are present in multiple lung zones bilaterally. There’s a heterogeneous pattern with no clear dependent gradient and spared areas. In addition, despite all of these B-lines, no pleural effusions. So how do we then incorporate that into our case?
Guidance from Intensive Care Medicine on Clinical Integration of Results
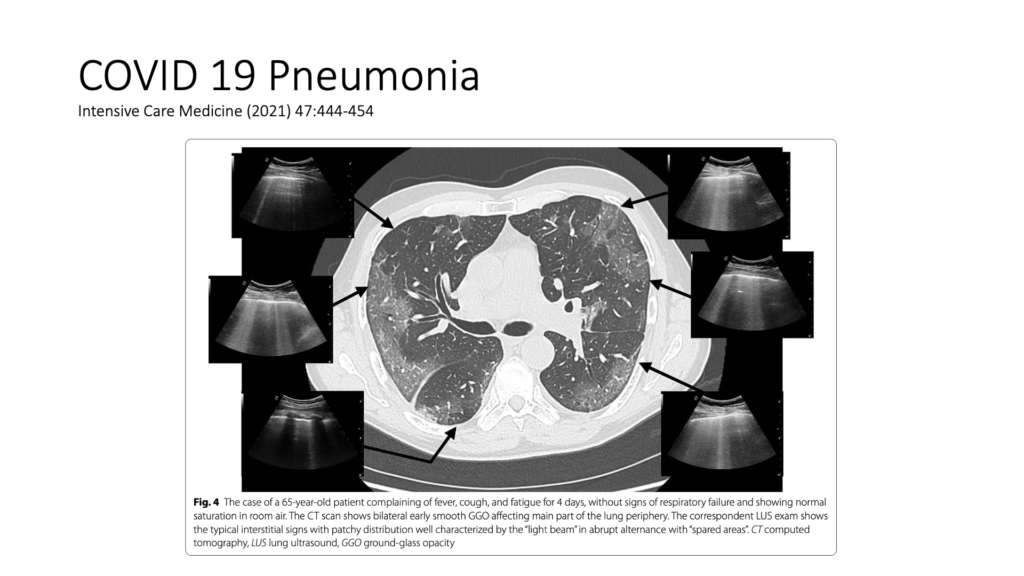
An article in Intensive Care Medicine did a really good job of the clinical integration piece. They described high probability lung scans and low probability lung scans. The high probability lung scan is bilateral, multi-focal, heterogeneous B-line pattern with peripheral consolidations associated with an iregular pleural contour with spared areas. And they suggested if you had this lung scan in a high prevalence period for COVID, that the specificity was around 90%. They commented that if you have a negative COVID test, you should exercise caution because the COVID tests are associated with false negatives. And when you have that high probability scan in a high prevalence period, we’ve got to think COVID.
Putting Together a Definitive COVID Diagnosis Following a Negative Test
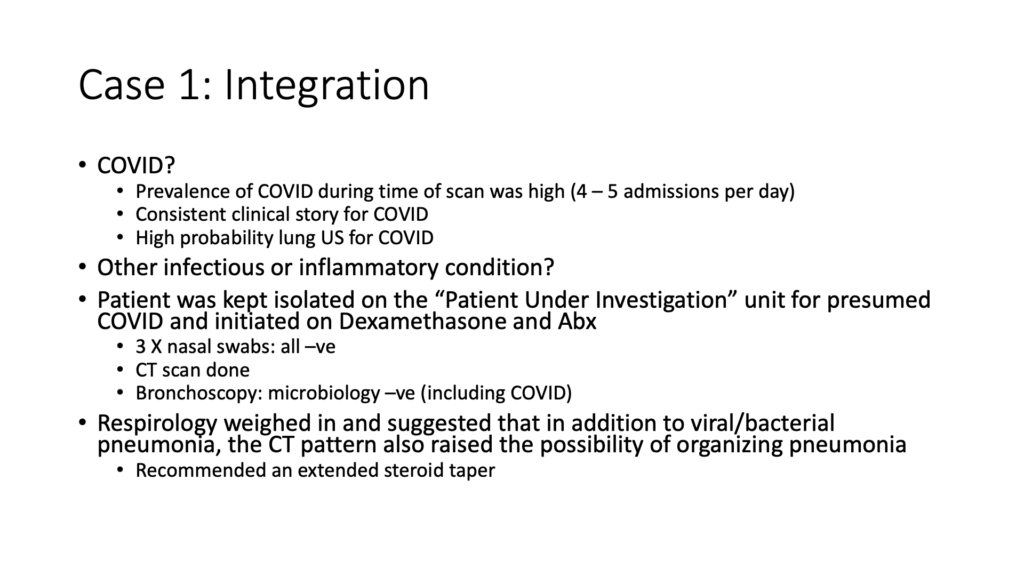
While other infectious or inflammatory conditions had to be considered, the high prevalence of COVID in the community, consistent clinical story and high probability lung ultrasound scan meant that our patient was kept on the “patient under investigation unit” for presumed COVID and was initiated on dexamethasone and antibiotics. In the end, three swabs were done and all were negative. A CT scan was done and respirology was consulted for a bronchoscopy. Microbiology from the BAL specimen was negative, including COVID.
Ultimately, the case was tough and we all felt that the patient probably did have a viral or bacterial pneumonia at some point and potentially even COVID despite the negative tests. In addition, the CT pattern in the end also raises possibility of an organizing pneumonia.
One of the COVID sequelae that we’re seeing very commonly. Respirology recommended an extended steroid taper. Ultimately, the patient did well. He had an extended period of hypoxia, but with the steroid taper, we did see improvements over time.
In the end, the ultrasound scan told us that we could not exclude COVID. And even if we can’t prove it, he went on to develop what looked like a complication related to COVID.
Guidance from Cleveland Clinic on Cardiogenic Pulmonary Edema Vs. Non-Cardiogenic Causes
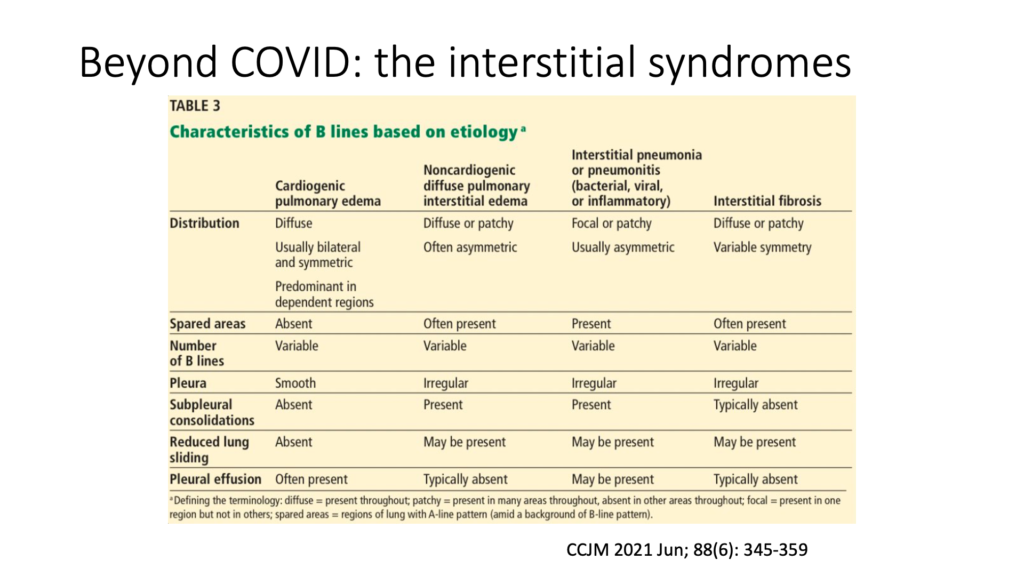
Let’s review one last table released in the Cleveland Clinic Journal of Medicine in June 2021. Lung scanning is a particularly powerful tool to differentiate between cardiogenic and non-cardiogenic causes of dyspnea. They have done a great job here of summarizing findings associated with different types of interstitial syndromes, and then showed the patterns that you see from cardiogenic pulmonary edema compared to those non-cardiogenic causes, including interstitial pneumonias.“
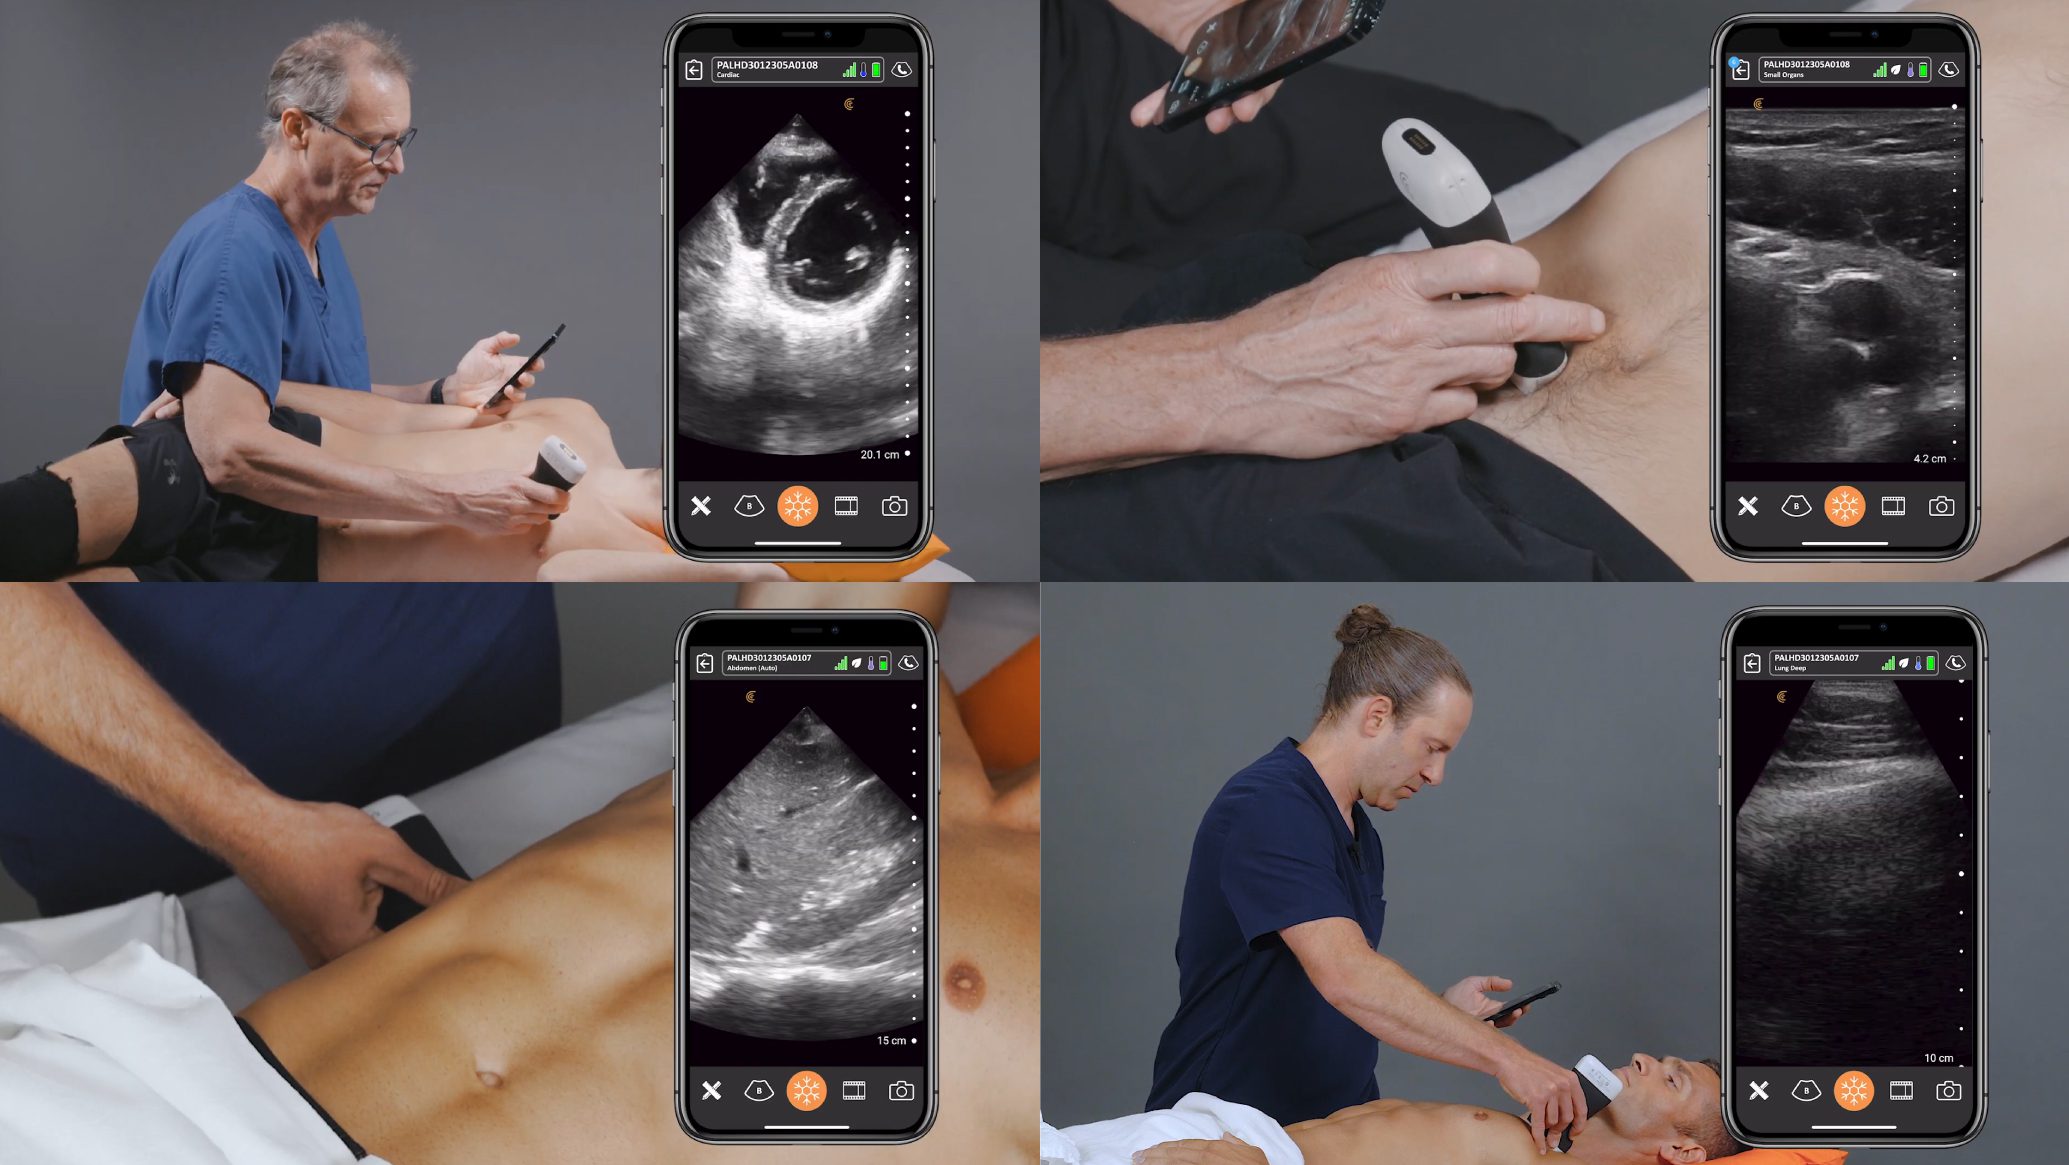
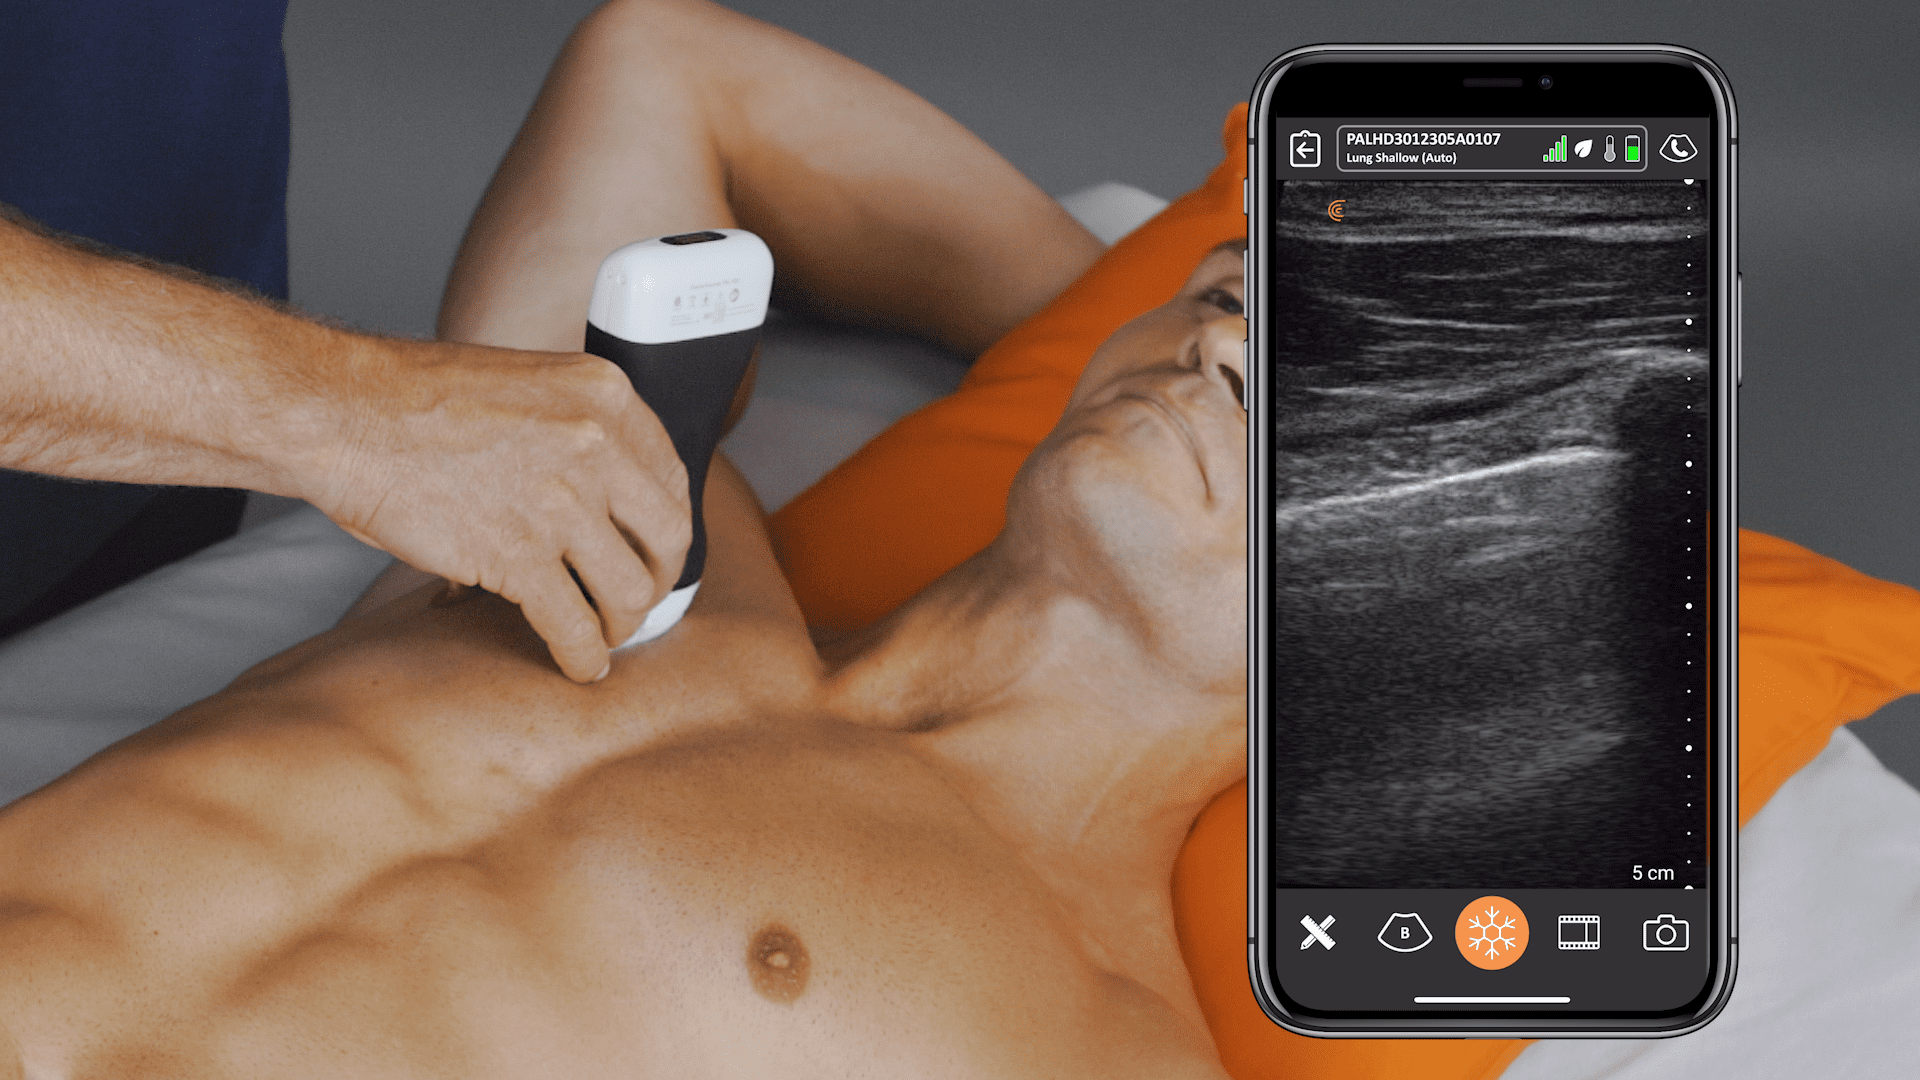
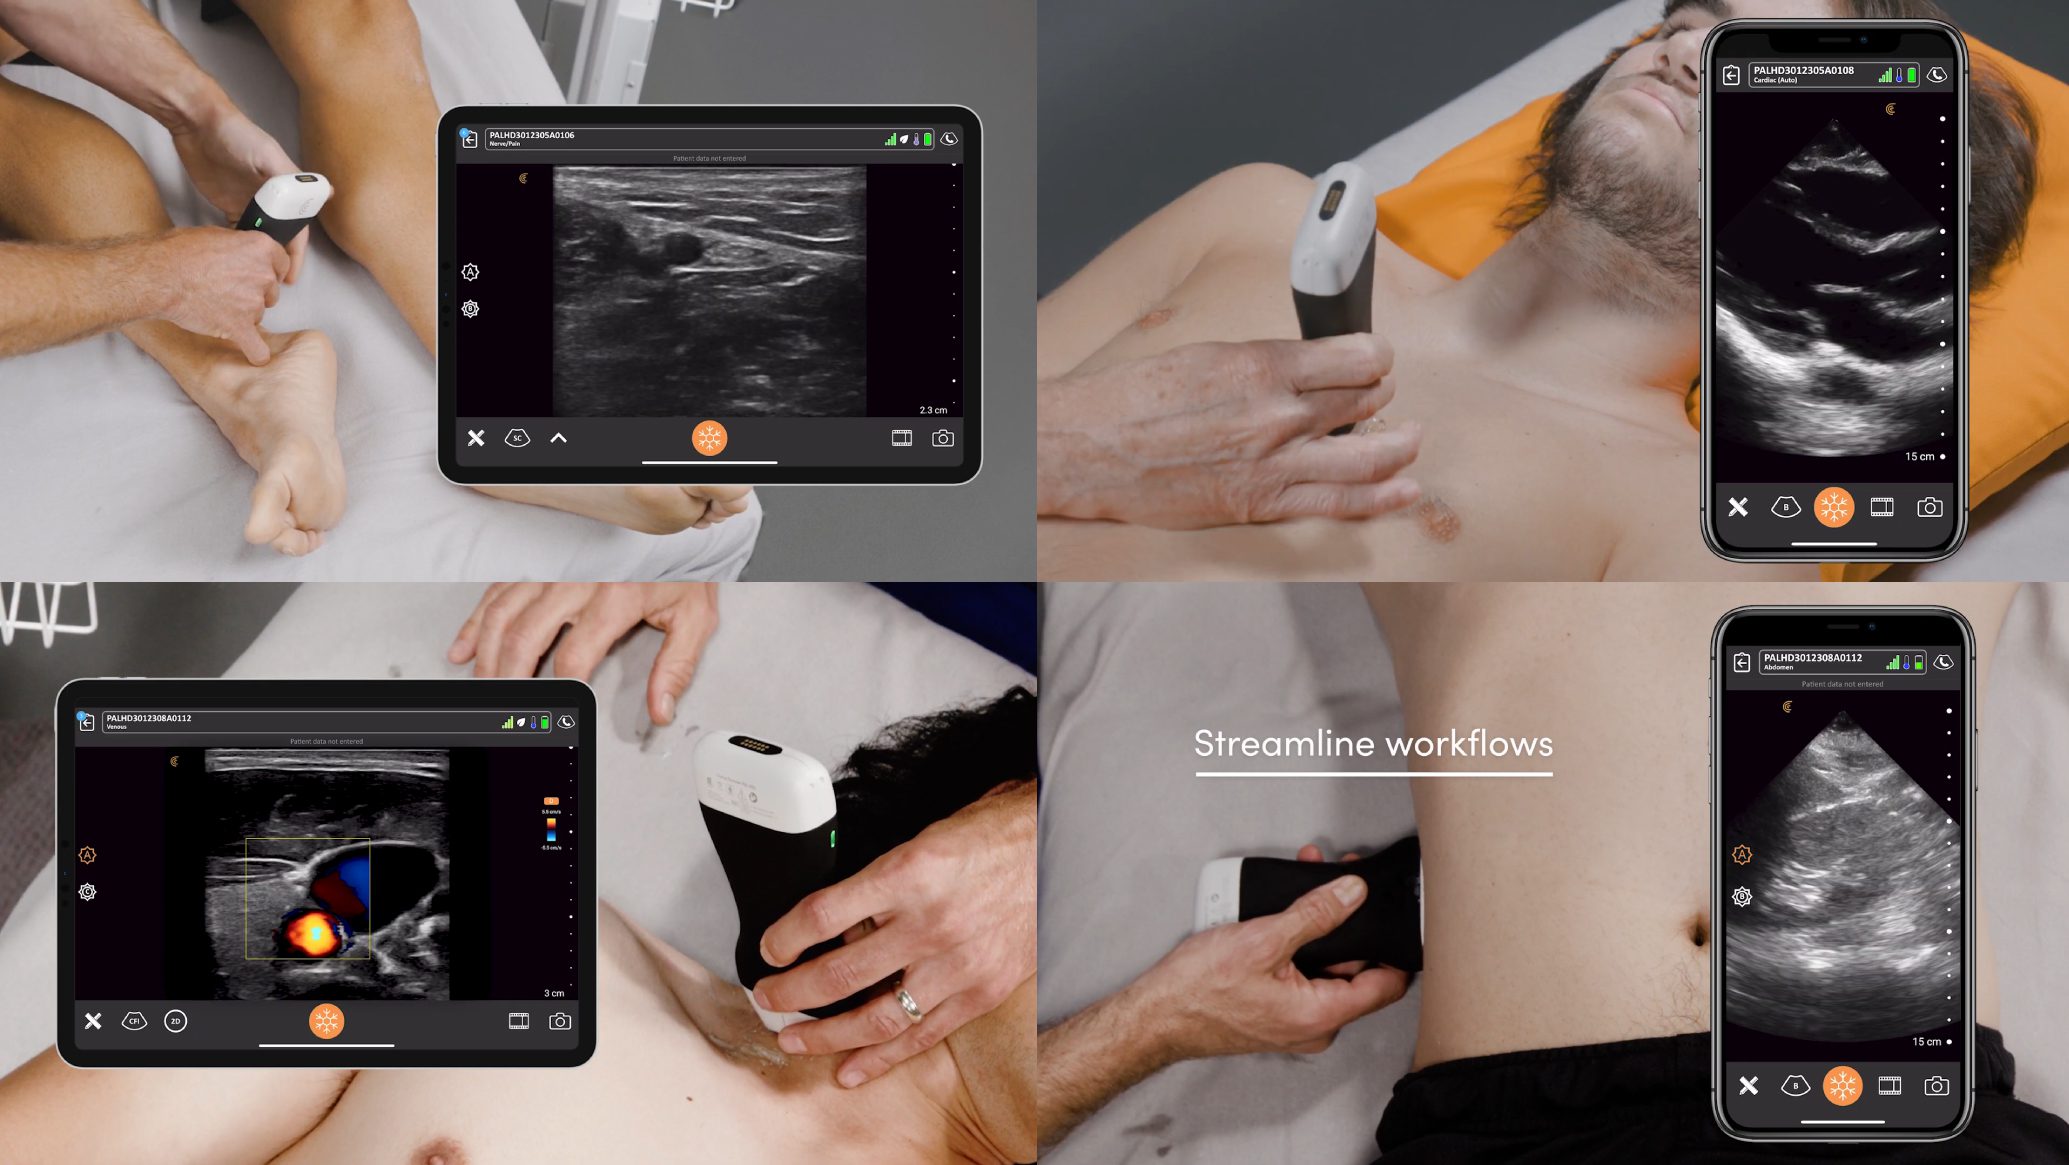
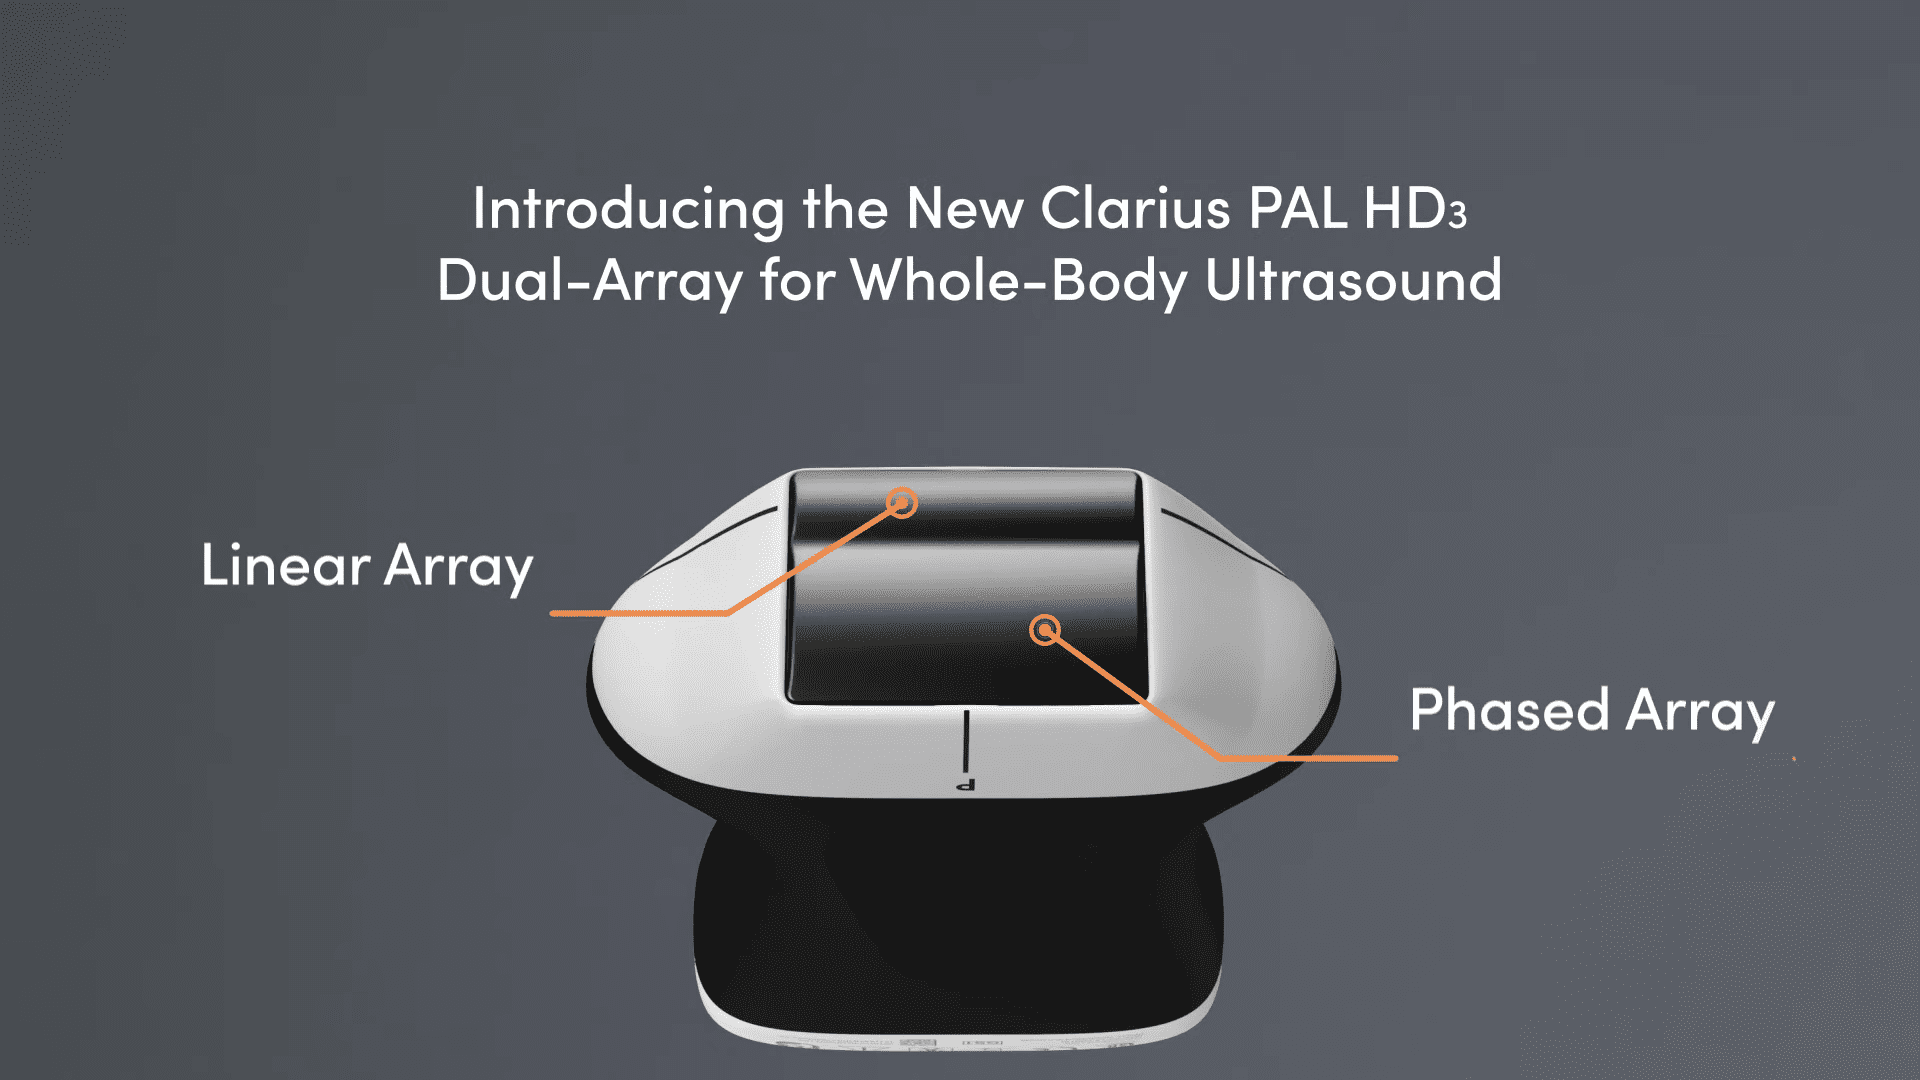
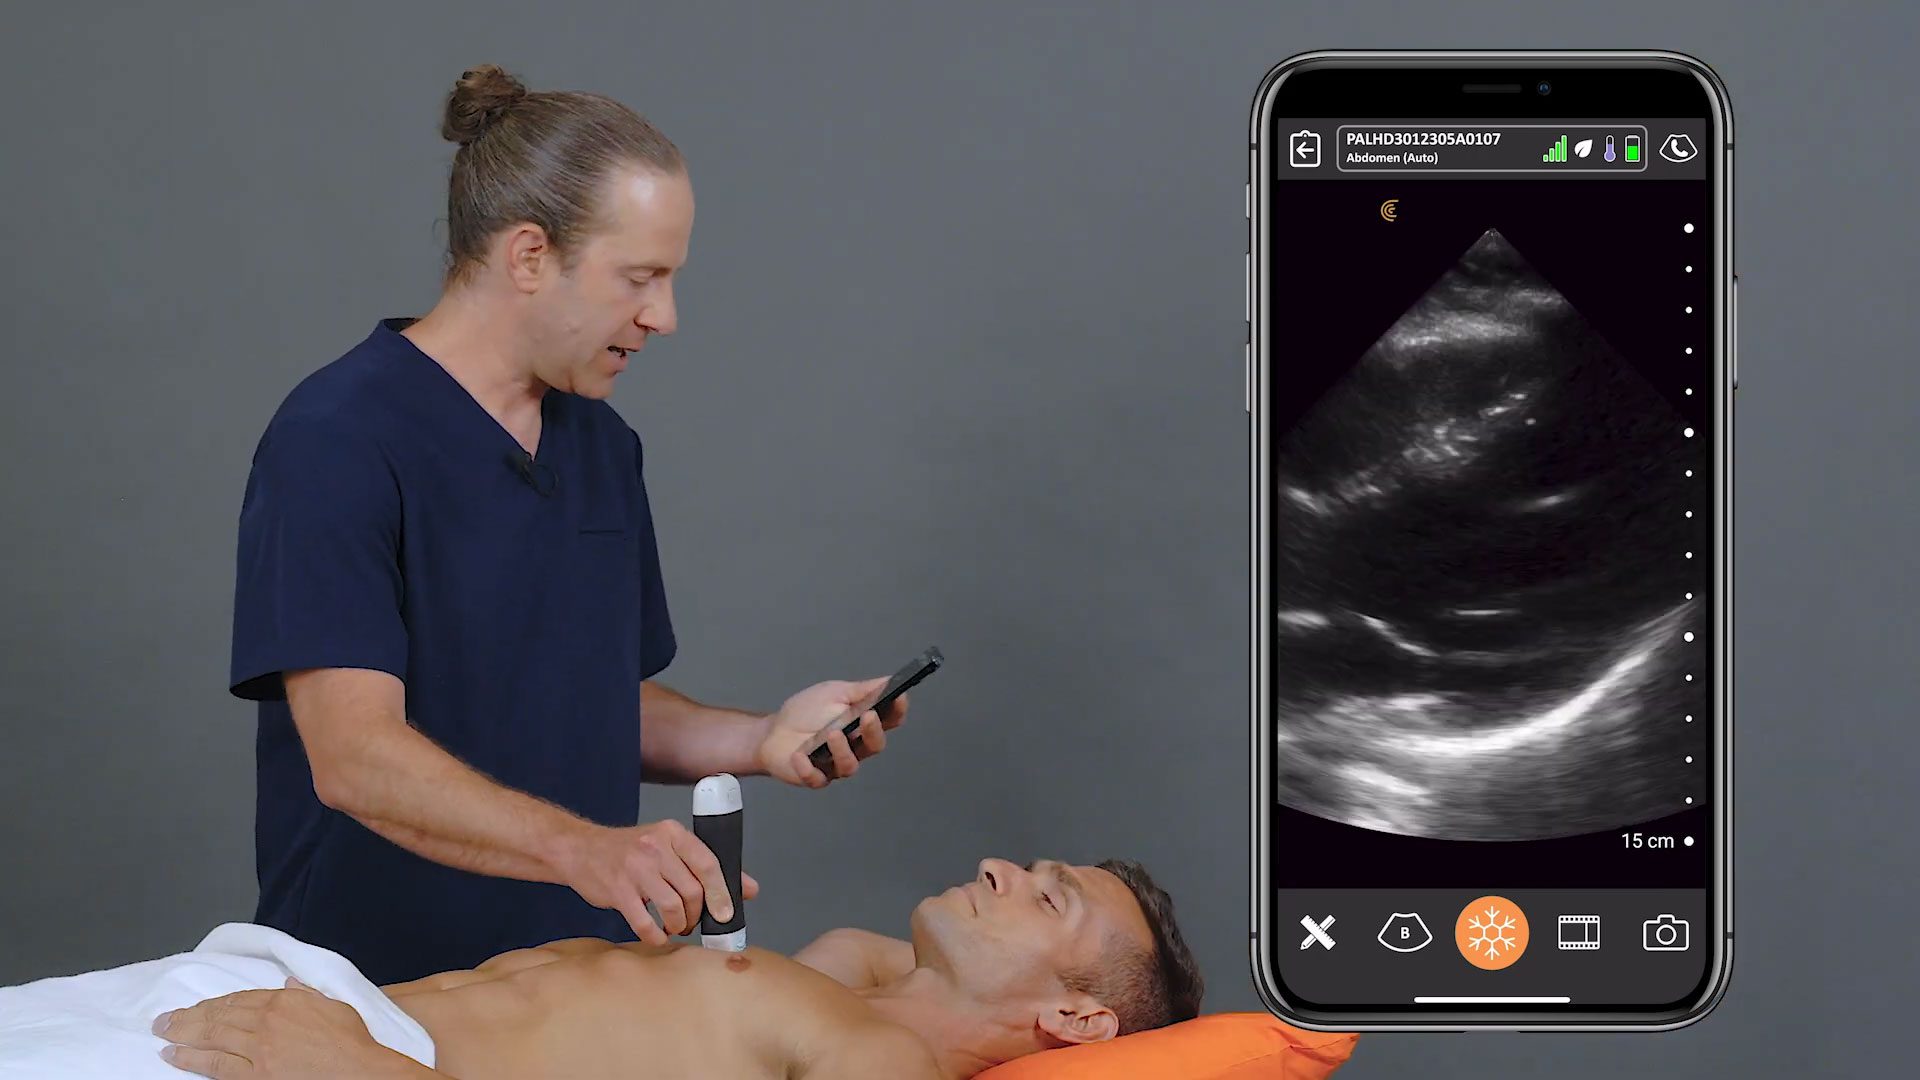
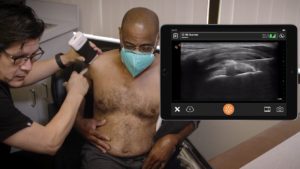
About Clarius Ultrasound for Lung Scanning and More
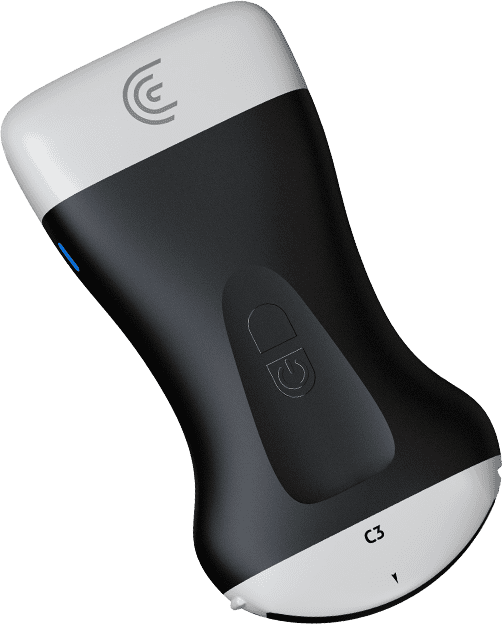
Wireless and app-based, Clarius delivers fast imaging and sharp detail at the point of care. Cover the scanner and your smartphone completely to reduce the risk of infection. Dr. Arishenkoff, MD, FRCPC used the Clarius C3 HD to capture the ultrasound clips and images he used for his COVID-19 case study. The Clarius C3 HD multipurpose ultrasound scanner is also suitable for lung exams. Visit our Emergency Medicine specialty page to learn more about Clarius. Or contact us today to request an ultrasound demo.


